Trying to manage your safety and compliance with paper or spreadsheets, or across a range of
platforms, is no easy feat. Not only are you spending a bunch of time manually compiling records
from multiple places and running reports, but you’re missing out on the speed and power of turning
real-time data into powerful insights.
We understand the importance of preventing safety and compliance issues before they occur, and
analyzing real-time data makes this easy to do.
Donesafe dashboards are like your very own safety command center – with all the information,
actions and reporting relevant to your role, on the one page. While Donesafe captures a whole range
of data within the system, dashboards enable you to bring to the surface what matters most to you.
You can visualize the performance of your overall organization, your team, or your actions, and drill
into data for more detail if something stands out.
What’s more, dashboards are perfect for having a single place for insights across any number of
Donesafe apps you have. There’s no need to try and mash together reporting across a range of
systems designed to handle independent safety processes – the flow of data is all in one place.
Easily access dashboards on any device – smartphone, laptop or iPad.
Check out the video below for a quick preview!
How do dashboards work?
Four default dashboard types are enabled within any Donesafe environment, to align with four main
roles within a safety and compliance workplace structure. Depending on your role and business
requirements, you may have access to one or more of these dashboards:
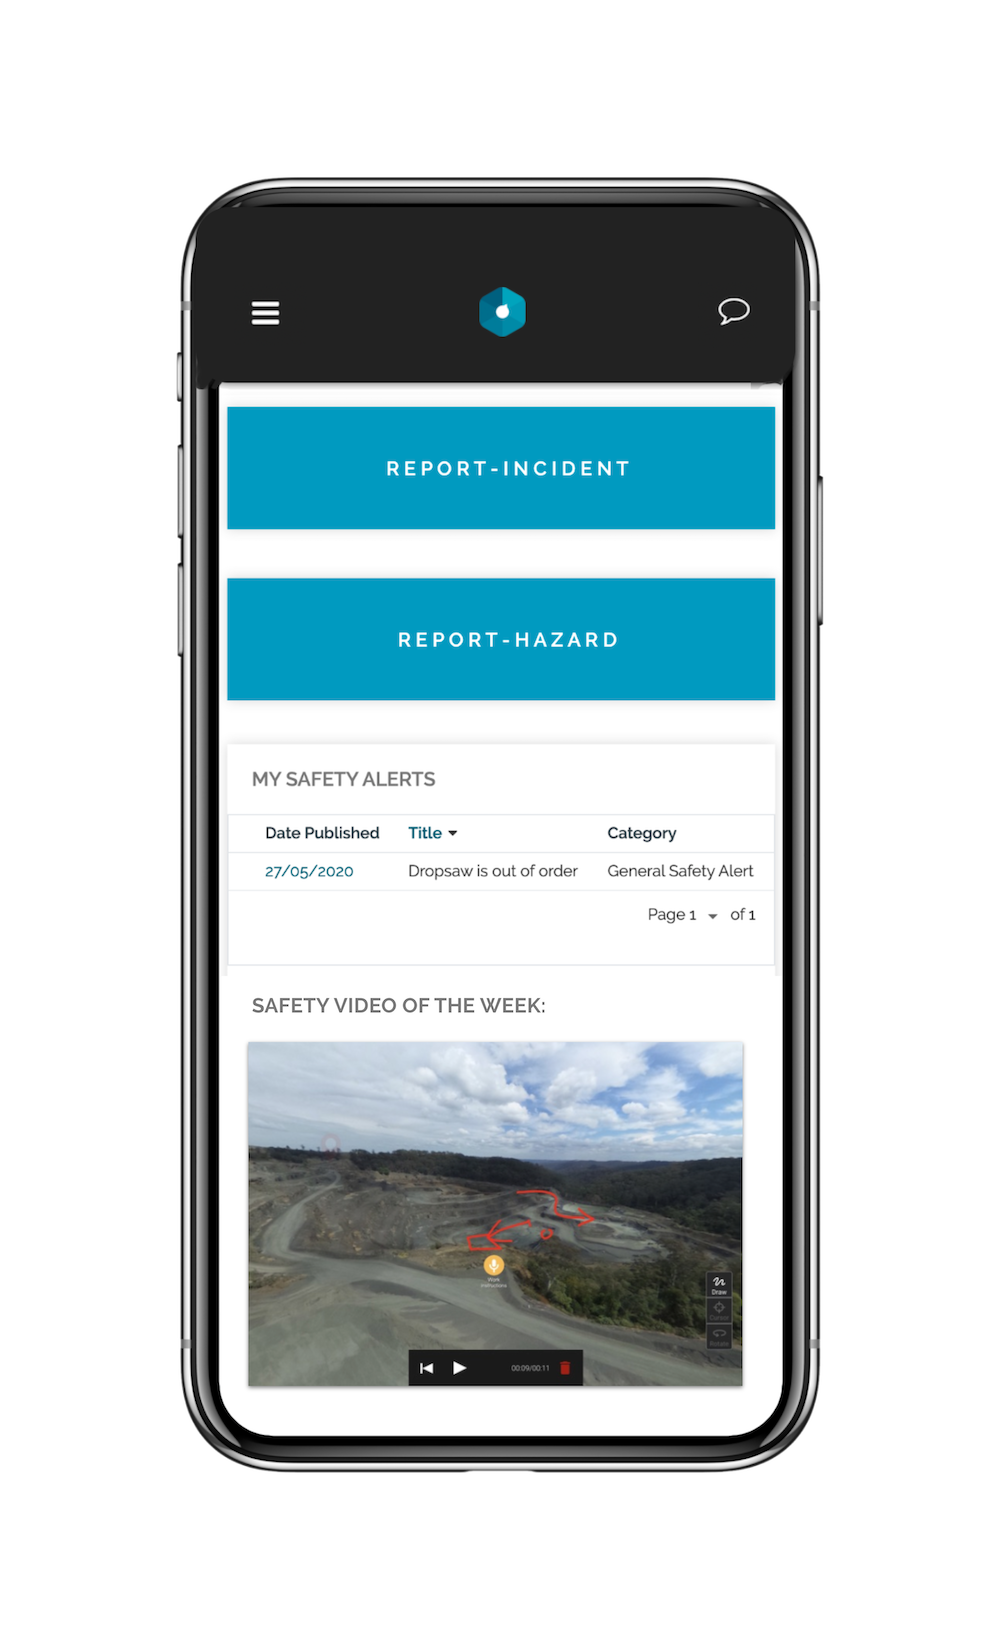
1. My Daily Dashboard
This is the employee dashboard. It’s simplified to enable workers to access core tasks and actions,
for instance, hot buttons to easily log incidents and hazards, start safety meetings, and more, along
with accessing daily tasks, safety alerts, and relevant information from their managers.
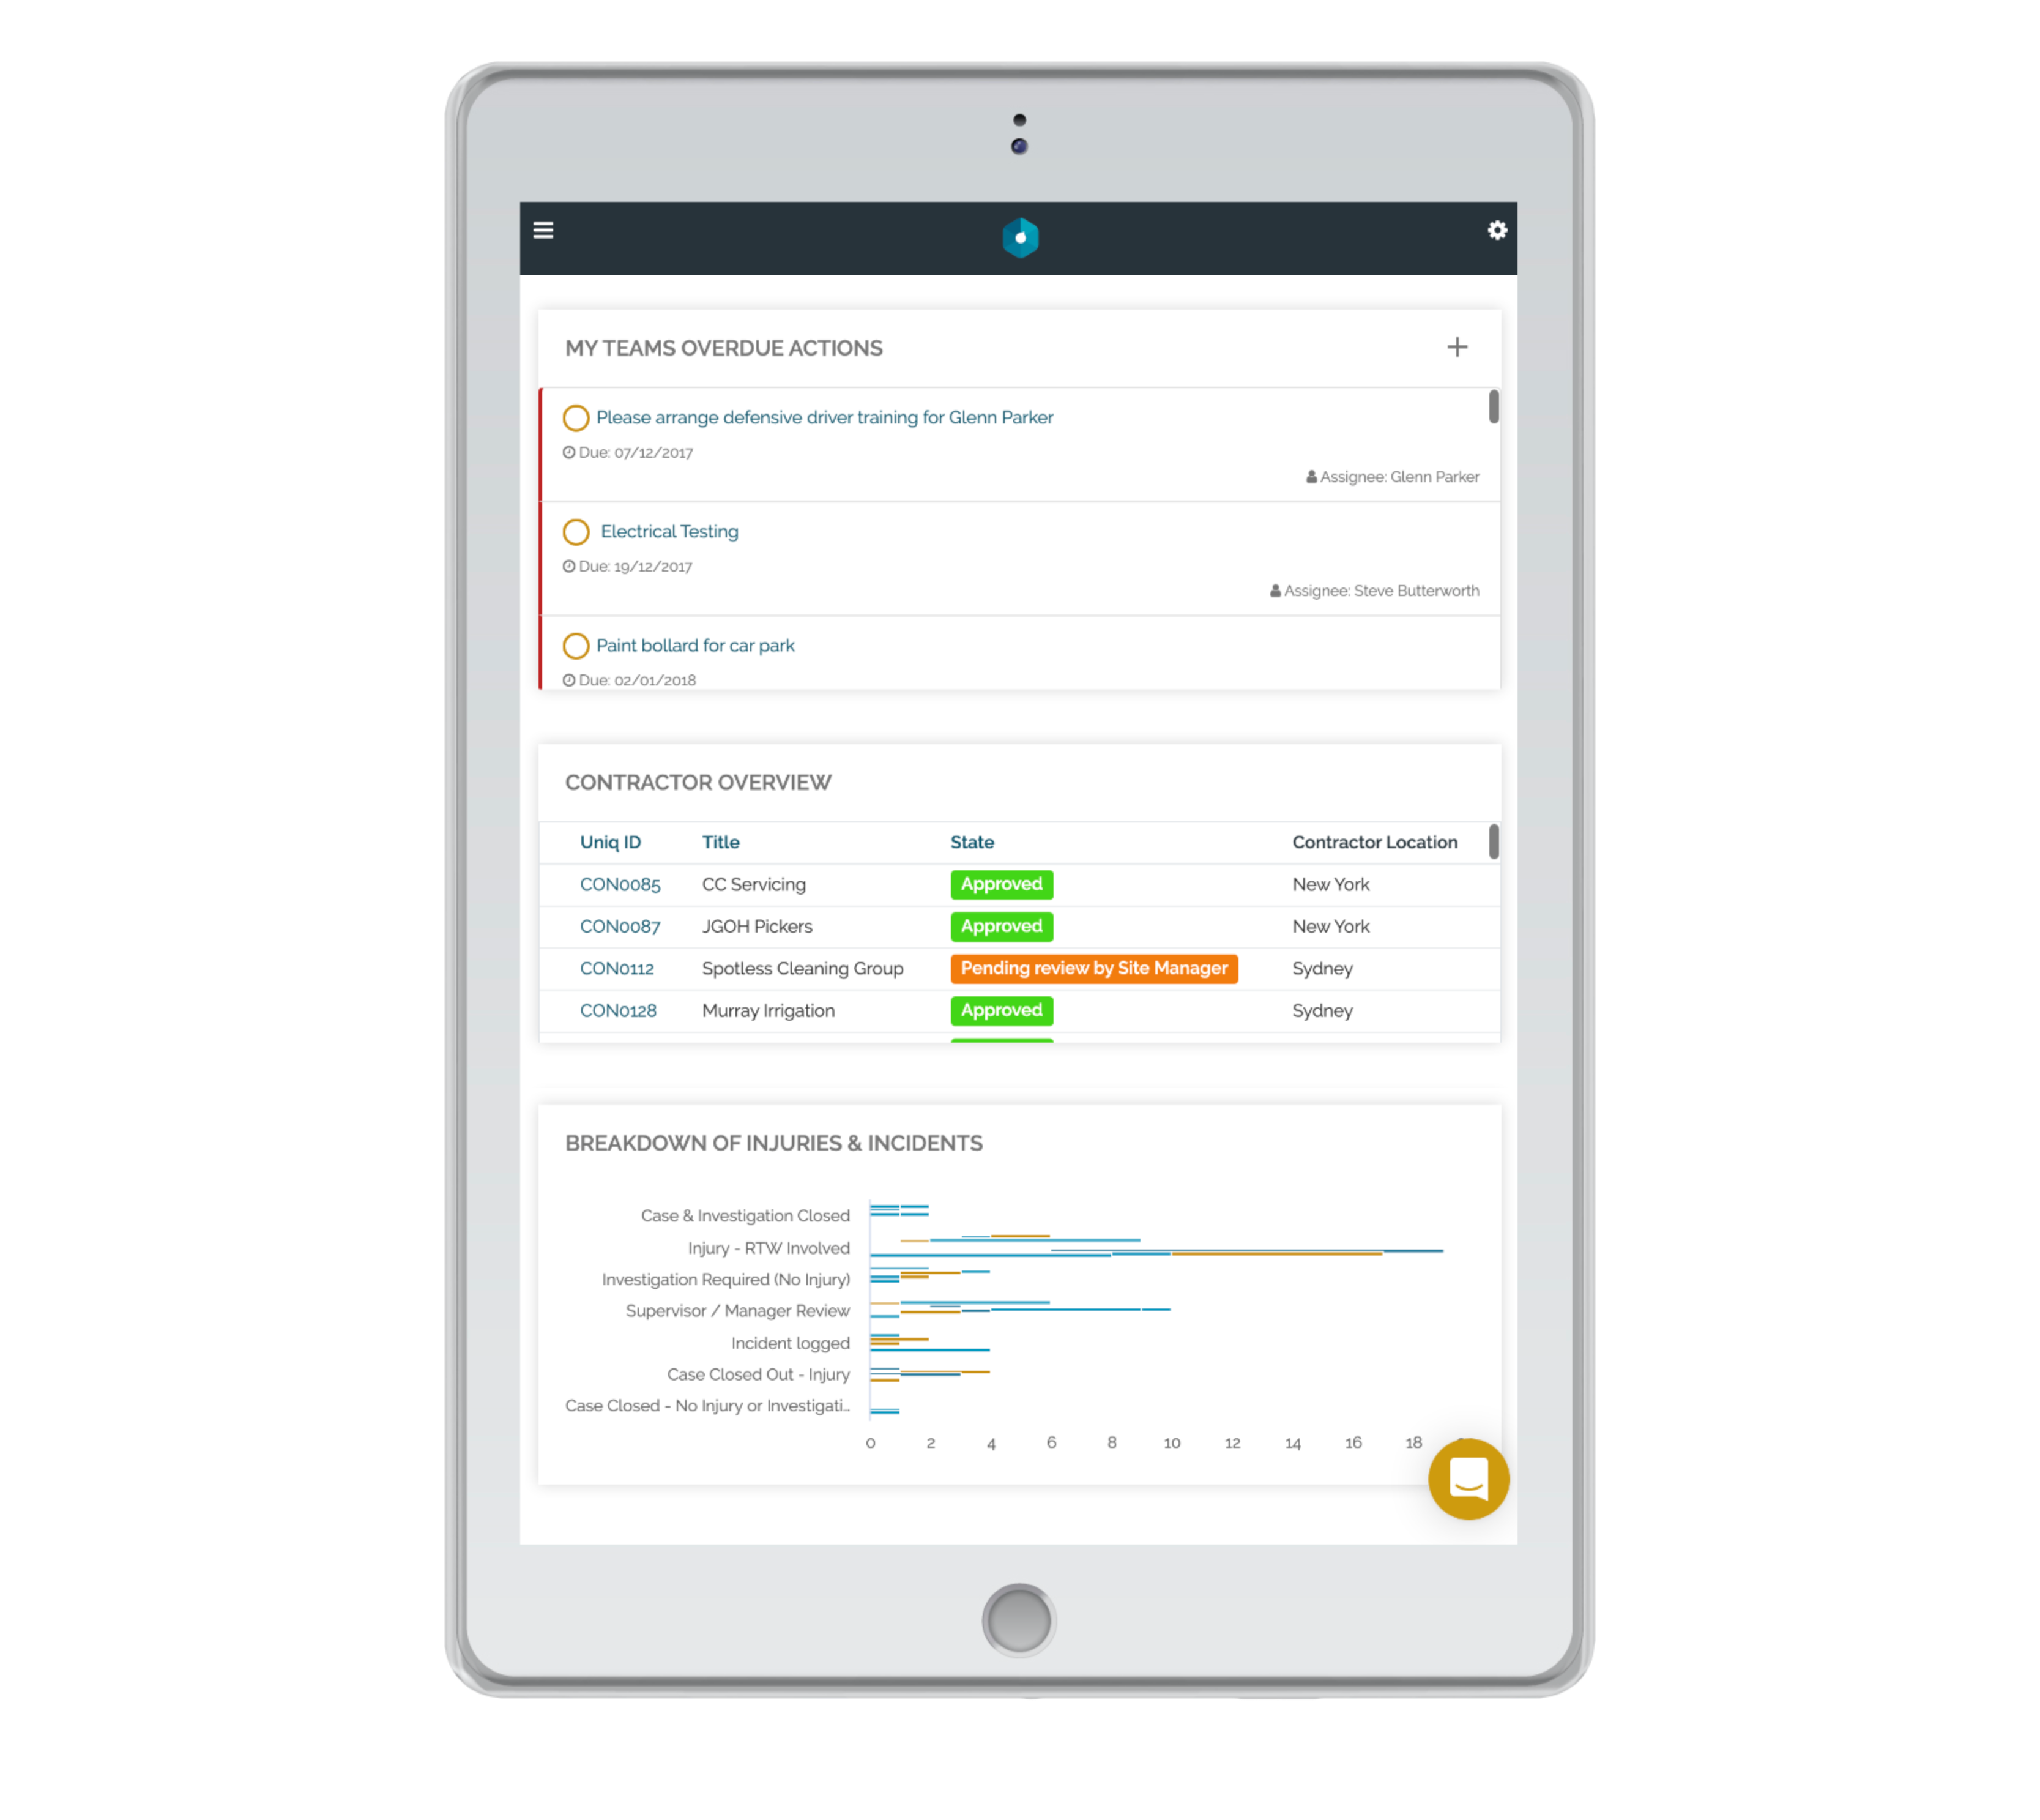
2. My Team Dashboard
Typically for managers who need oversight across their team, and wish to surface daily actions or
information they need to deal with, such as escalations, alerts, follow-ups or closeouts.
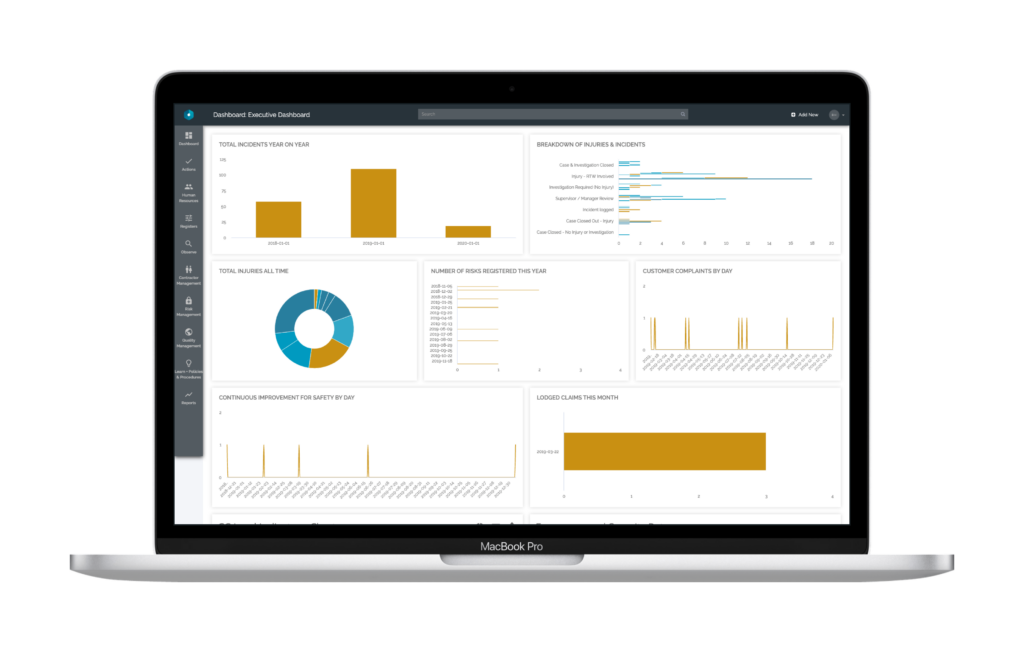
3. Stats Dashboard
Captures data and insights across your entire organization, so you can easily report to the executive
team. (Or, you can give them their direct access to this Stats Dashboard.)
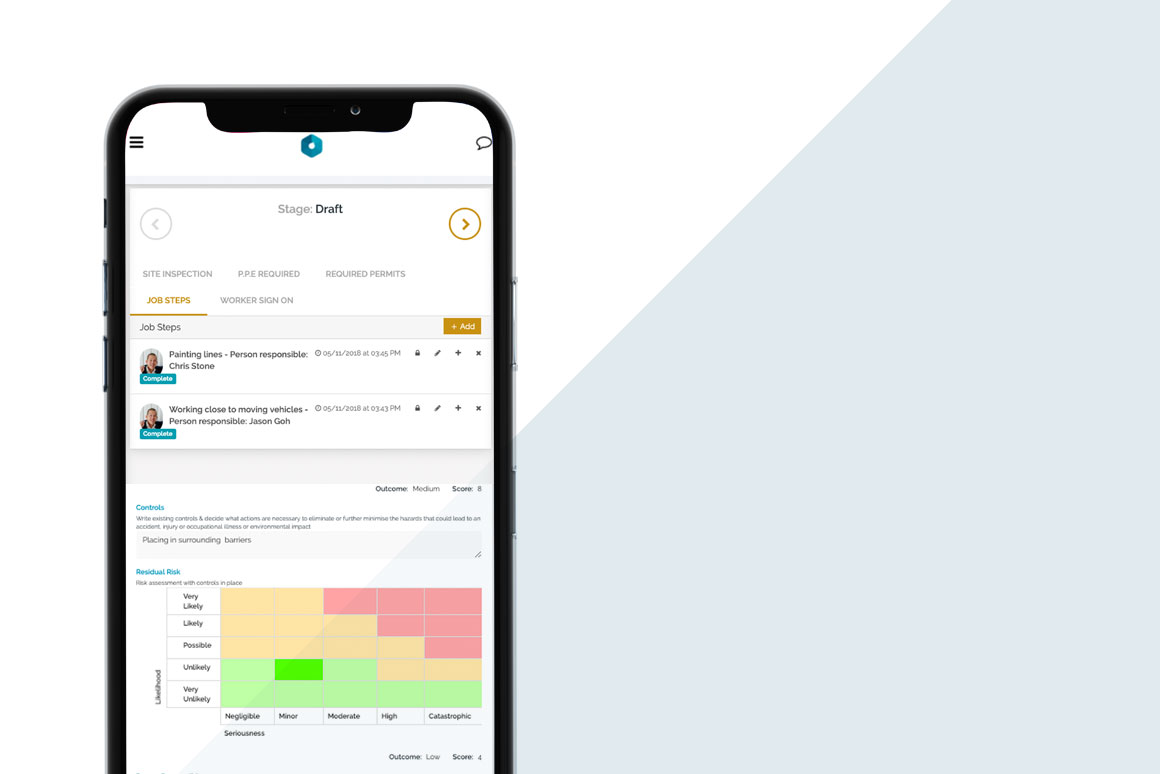
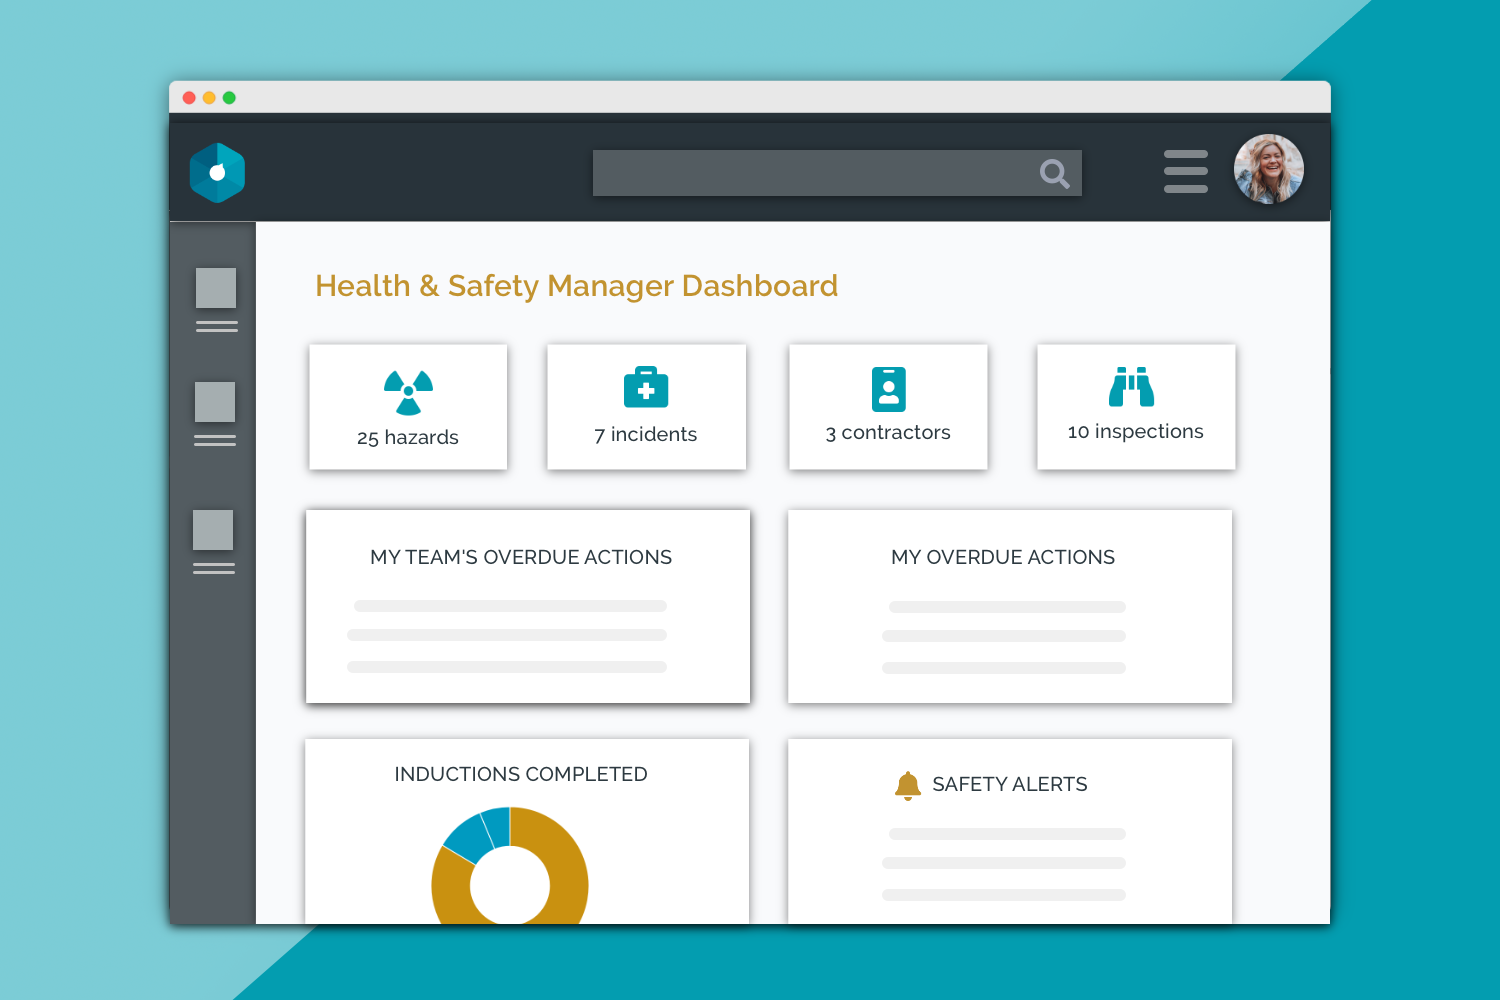
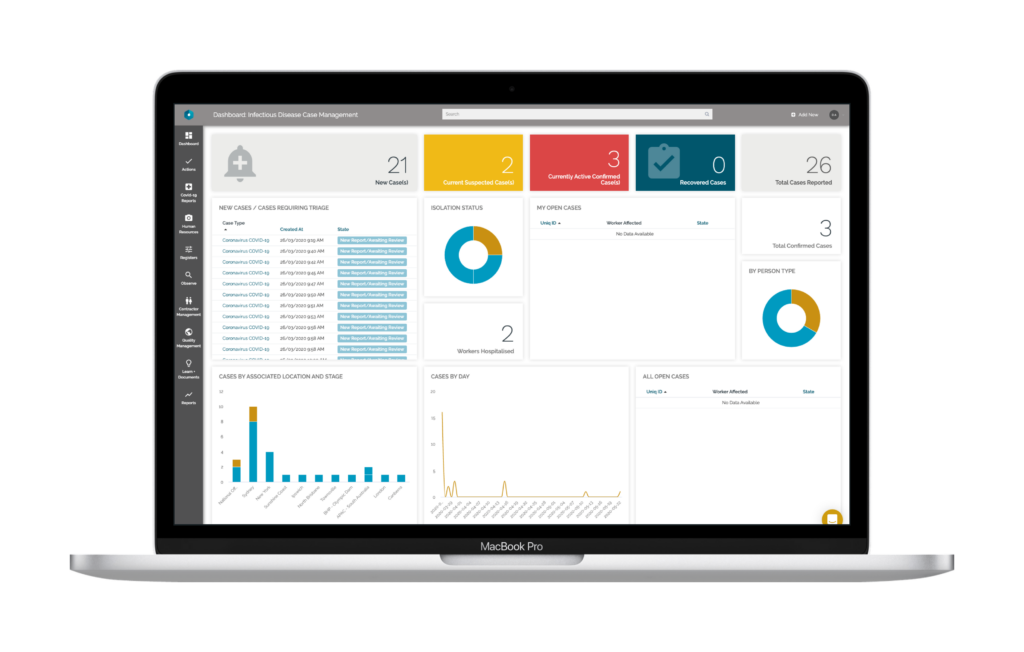
4. Subject-Specific Dashboard
This dashboard is for specific areas of focus, for example, safety, quality, return to work, injury
management, or Coronavirus tracking.
These dashboard types are all able to be further configured.
Dashboards are the default landing page for everyone that accesses your Donesafe environment.
This ensures everybody has their finger on the pulse for the action items and data relevant to them.
As events occur throughout your organization and are logged in Donesafe, the data immediately
feeds into the relevant dashboard/s. This ensures that everyone has oversight where needed, can
manage their tasks, and can see data and reporting to enable them to make improvements.
Some of the cool features of dashboards
- Configurable via a drag and drop widget builder: Not only do you have different types of dashboards, but you can configure, add to or remove dashboard components via our easy drag and drop widget builder.
- Configure how information is displayed: Need to see the data in a different format? Update the format to showcase data in the way that best suits you.
- Add/remove new widgets to dashboards at any time: You can easily add or remove widgets from the dashboard at any time with just a few clicks. E.g. easily add a safety video of the week to your employees’ dashboard.
- Reorder widgets: Rearrange your dashboard to showcase the most important information first, and the less important last.
- Choose widget types from an extensive dropdown: Pick between a range of widget types for how data will display: actions, iframe, image, link, record index, report count, report data, report graph, sub-form index, text or video.
- Customizable look and feel: Not only can you select the colors used in your dashboard to match your brand, you can also customize icons, widget size and widget position on the page.
To learn more about dashboards, book a demo with our team:
Book a Demo
Share: