In Australia, we dedicate the month of October to the National Safe Work Month awareness
campaign and this year our focus shifts slightly to workplace health and safety through COVID19. This week features the use of data to make workplaces safer, acknowledging the impacts of
COVID-19 and encouraging best practice for WHS.
What is workplace health and safety data?
Data can be any information gathered from the workplace and through working activities – facts and
statistics collected for reference or analysis. This includes paper-based forms, spreadsheets, emails,
online management systems, and alerts. The list goes on.
The data can, and should be, collected from incidents and injuries, hazards, audits, checklists,
observations, risks, PPE registers, drug and alcohol testing, COR (Chain of Responsibility),
contractor management, visitors, safety alerts and other aspects of workplace safety and
compliance.
How can data improve organizational safety and promote a safer workplace?
It’s a great question … we often find ourselves surrounded by mountains of data daily, especially in
the workplace. Yet it’s what we do with it that can provide efficiencies and ways to support a safer
environment.
One of our four pillars at Donesafe is the power of data and how to turn data into intelligence.
Real-time data can improve your safety across your organization, increasing reporting and
highlighting problematic areas.
The use of data and statistics assists with being proactive and preventative when it comes to safety and compliance issues, addressing them before they occur. Through the analysis of real-time reporting and dashboards, this formulizes and highlights important information into specific areas.
Data can be extremely powerful in order to future proof and reduce the causes of injuries and
incidents, as well as in understanding your industry from a safety perspective. When combining
powerful insight tools and the instant flow of data, you will know exactly where you stand on
workplace health and safety. The importance of getting this right helps to reduce
the statistics outlined below
Key WHS statistics Australia
Safe Work Australia, Key Work Health and Safety Statistics in 2020 provides an overview of the latest
national data on work-related fatalities and workers’ compensation claims. This includes trends,
gender and age comparisons, and industry and occupation breakdowns for work health and safety
and serious workers’ compensation claims in Australia. Without the use of reporting, statistics and
problem areas cannot be reported on or highlighted for others.
We’ve taken some of the key statistics from the following report, work-related injury and disease – Key WHS statistics Australia 2020 report, more info here.
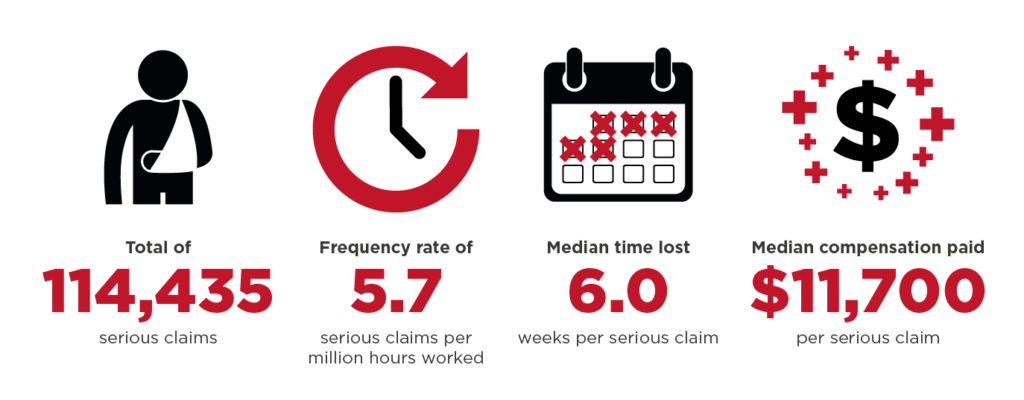
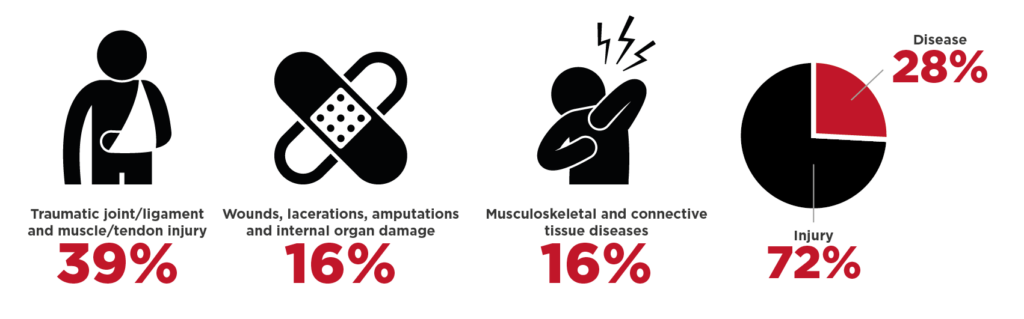
Serious claims statistics, 2018–19p*
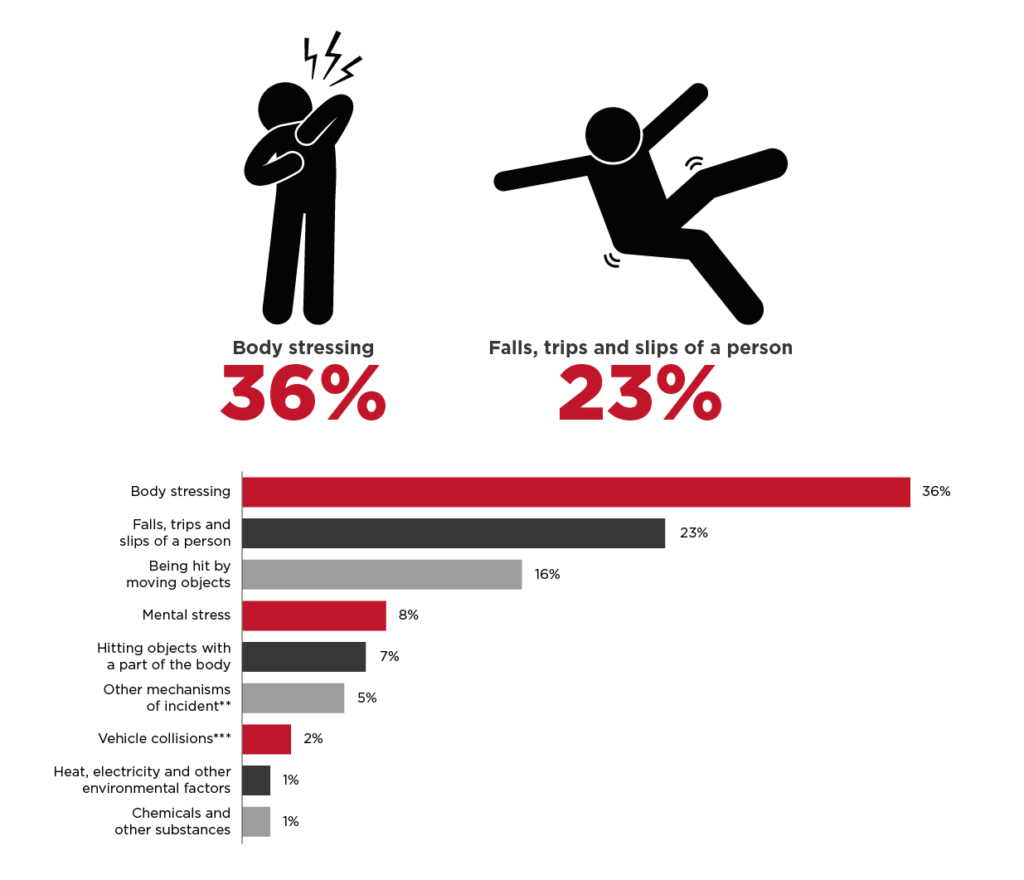
Serious claims by mechanism of incident, 2018–19p*
Serious claims by nature of injury/disease, 2018–19p*
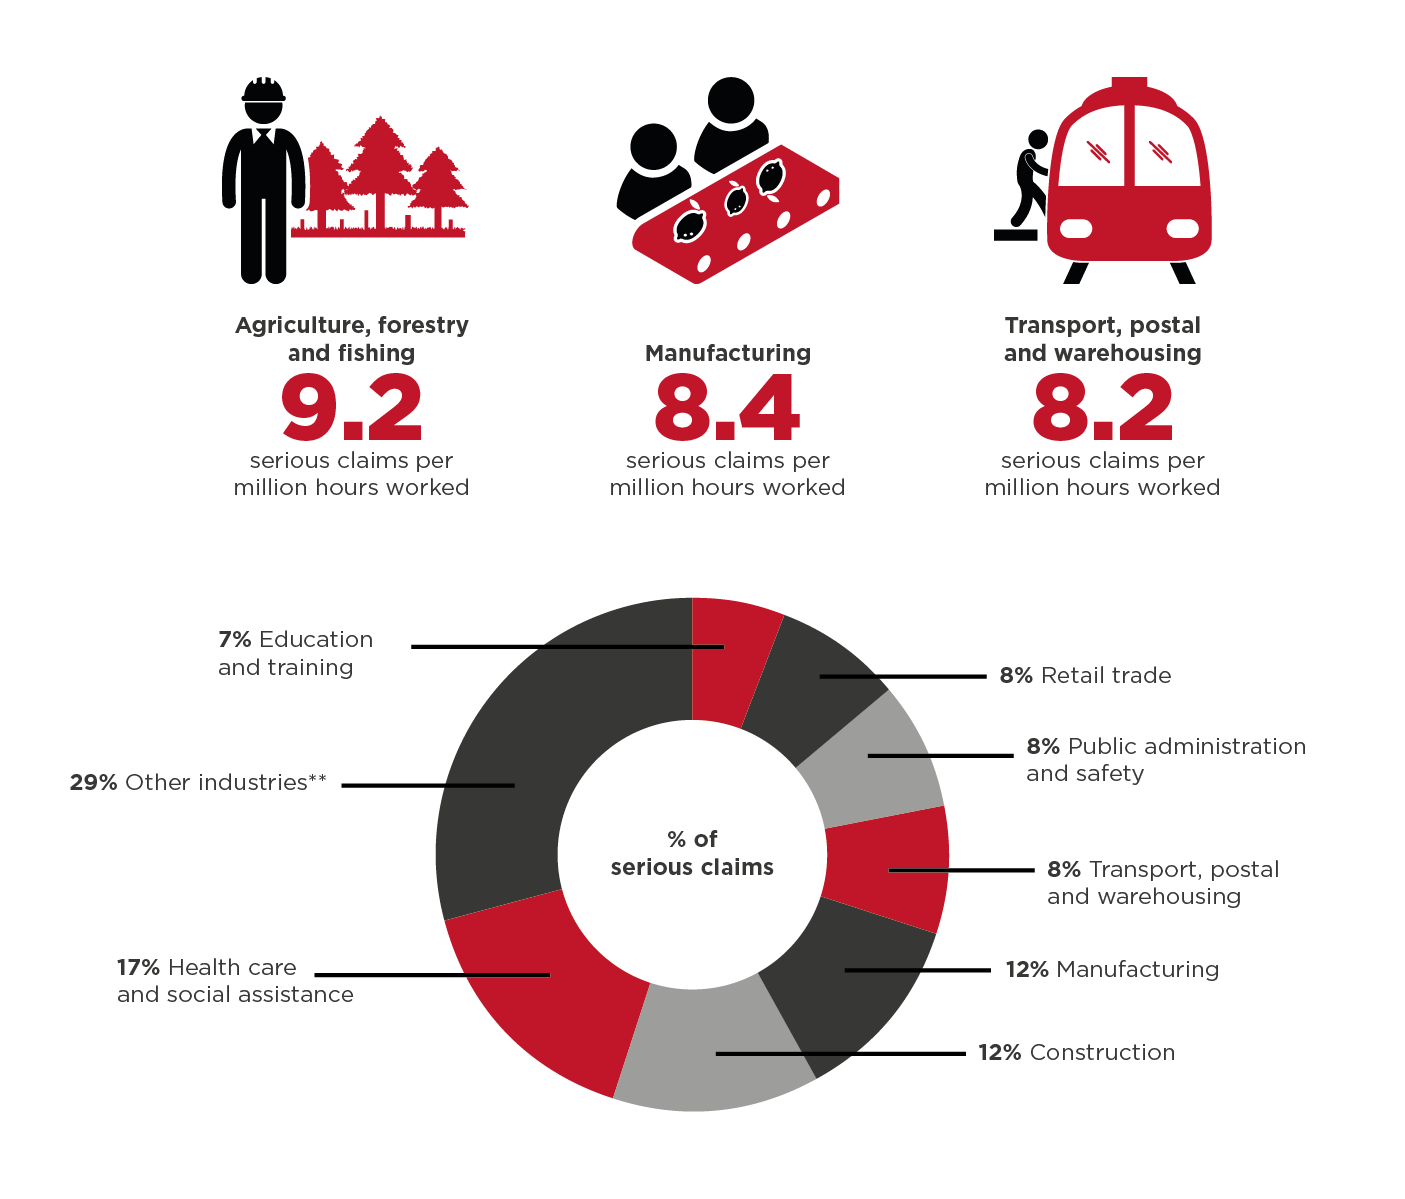
Serious claims by industry, 2018–19p*
How do we collate workplace health and safety data for purpose?
Understanding the causes of injury, and the industries most affected, can help reduce work-related
fatalities, injuries and disease.
Managing your safety and compliance via paper, spreadsheets or a combination of platforms creates
a time consuming and disconnected approach to reporting. Not only are you spending an
unnecessary amount of time manually compiling records from multiple places and running reports,
but you’re missing out on the speed and power of turning real-time data into powerful insights.
Through in-depth research and our safety community knowledge, we’ve found that disconnected systems and lack of information shared across organizations is extremely common when it comes to workplace health and safety. If you’re a safety manager thinking or shouting out loud, “Tell me more!” then stick with us. Organizations and safety managers are always looking at ways to improve processes and implement modern technology to create a safer working environment for everyone. One consolidated platform helps to reduce the time spent on reporting, administrative tasks and houses all the information with one log-in. This forms an understanding of the business overall, helps to prevent issues and removes repetitive tasks creating more time to focus on higher-value tasks.
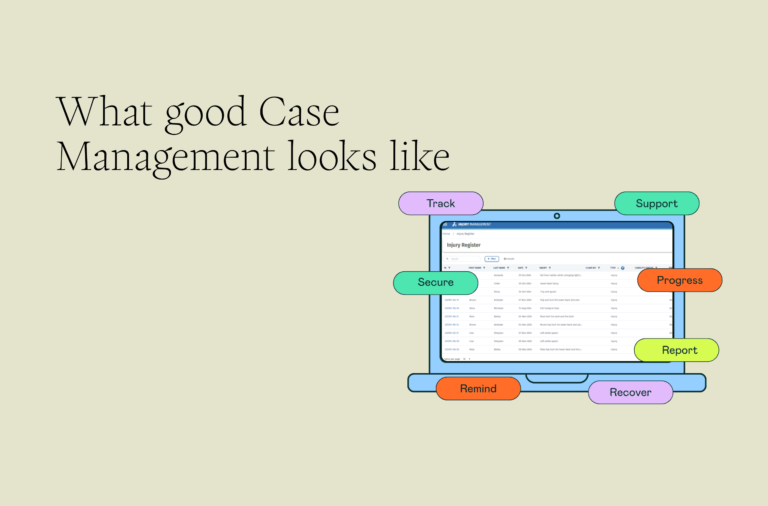
Donesafe’s reporting and dashboards collate all your safety data in the one place at a glance for records, actions, reporting relevant to your role and/or organization. Donesafe enables you to capture and track safety data across your entire organization, with our easy-to-read dashboards surfacing your most important data immediately. Imagine this, you can visualize the performance of your overall organization, your team or your own personal actions, AND drill into data for more detail if something stands out.
What’s more, dashboards are perfect for having a single place for insights across any number
of Donesafe apps you have. No need to try and mash together reporting across a range of systems
designed to handle independent safety processes – the flow of data is all in the one location.
More information on data and the power of insights here.
If you want to learn more about the Donesafe, book a demo with our team.
Book a Demo
Share: