Reporting in Donesafe is about to get a whole lot better. New reports have been a common request for a while now so rather than provide just one solution, we went a step ahead and built a tool that will allow you to build, save and download your own custom reports.
Essentially, the new report builder allows you to build a report to your own specifications. You can add and subtract filters, group the data in a number of ways and display the data on a line, bar, column or pie chart. Most importantly though it allows you to save your custom report settings and also export report data to CSV to allow you to run any type of report you can think of in Excel. In short; it’s a game changer.
Before we get into it though:
Disclaimer: The report builder is in Beta, a phase of development which means that it’s a pre-release of software that is given out to a large group of users to try under real conditions. In short, this means that if you run into any usability issues or errors, or even think of something we’ve missed when using it, that’s what a beta release is for! You’re encouraged to let us know. That’s how it gets better!
Let’s jump in section by section to help you understand the basics.
Surface any report by adding it as a widget on your dashboard
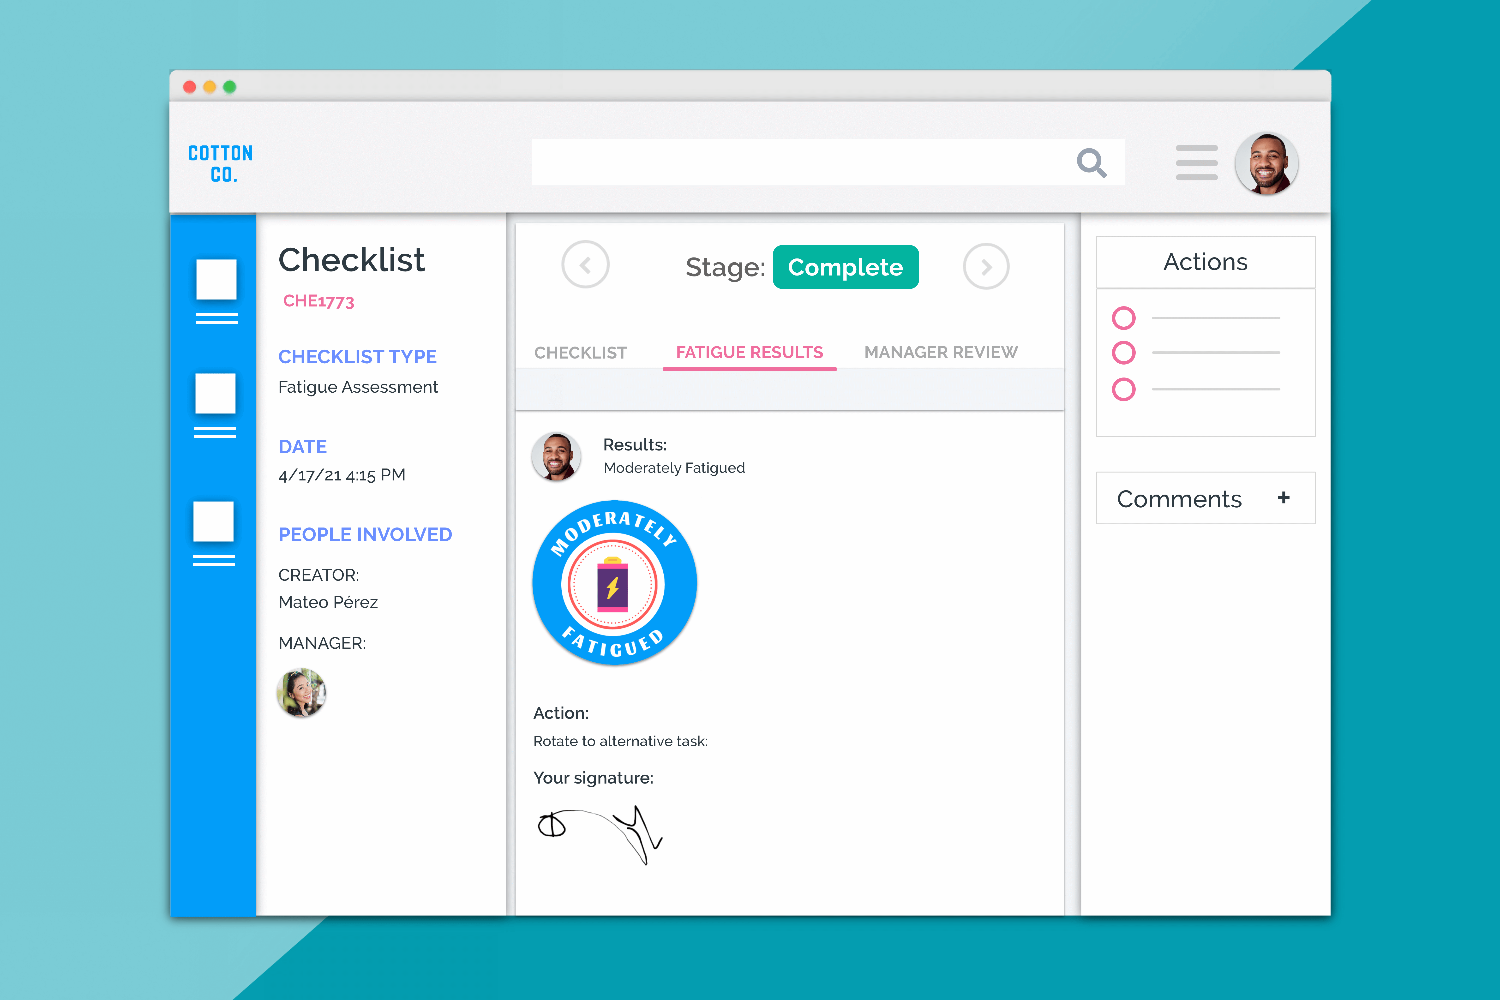
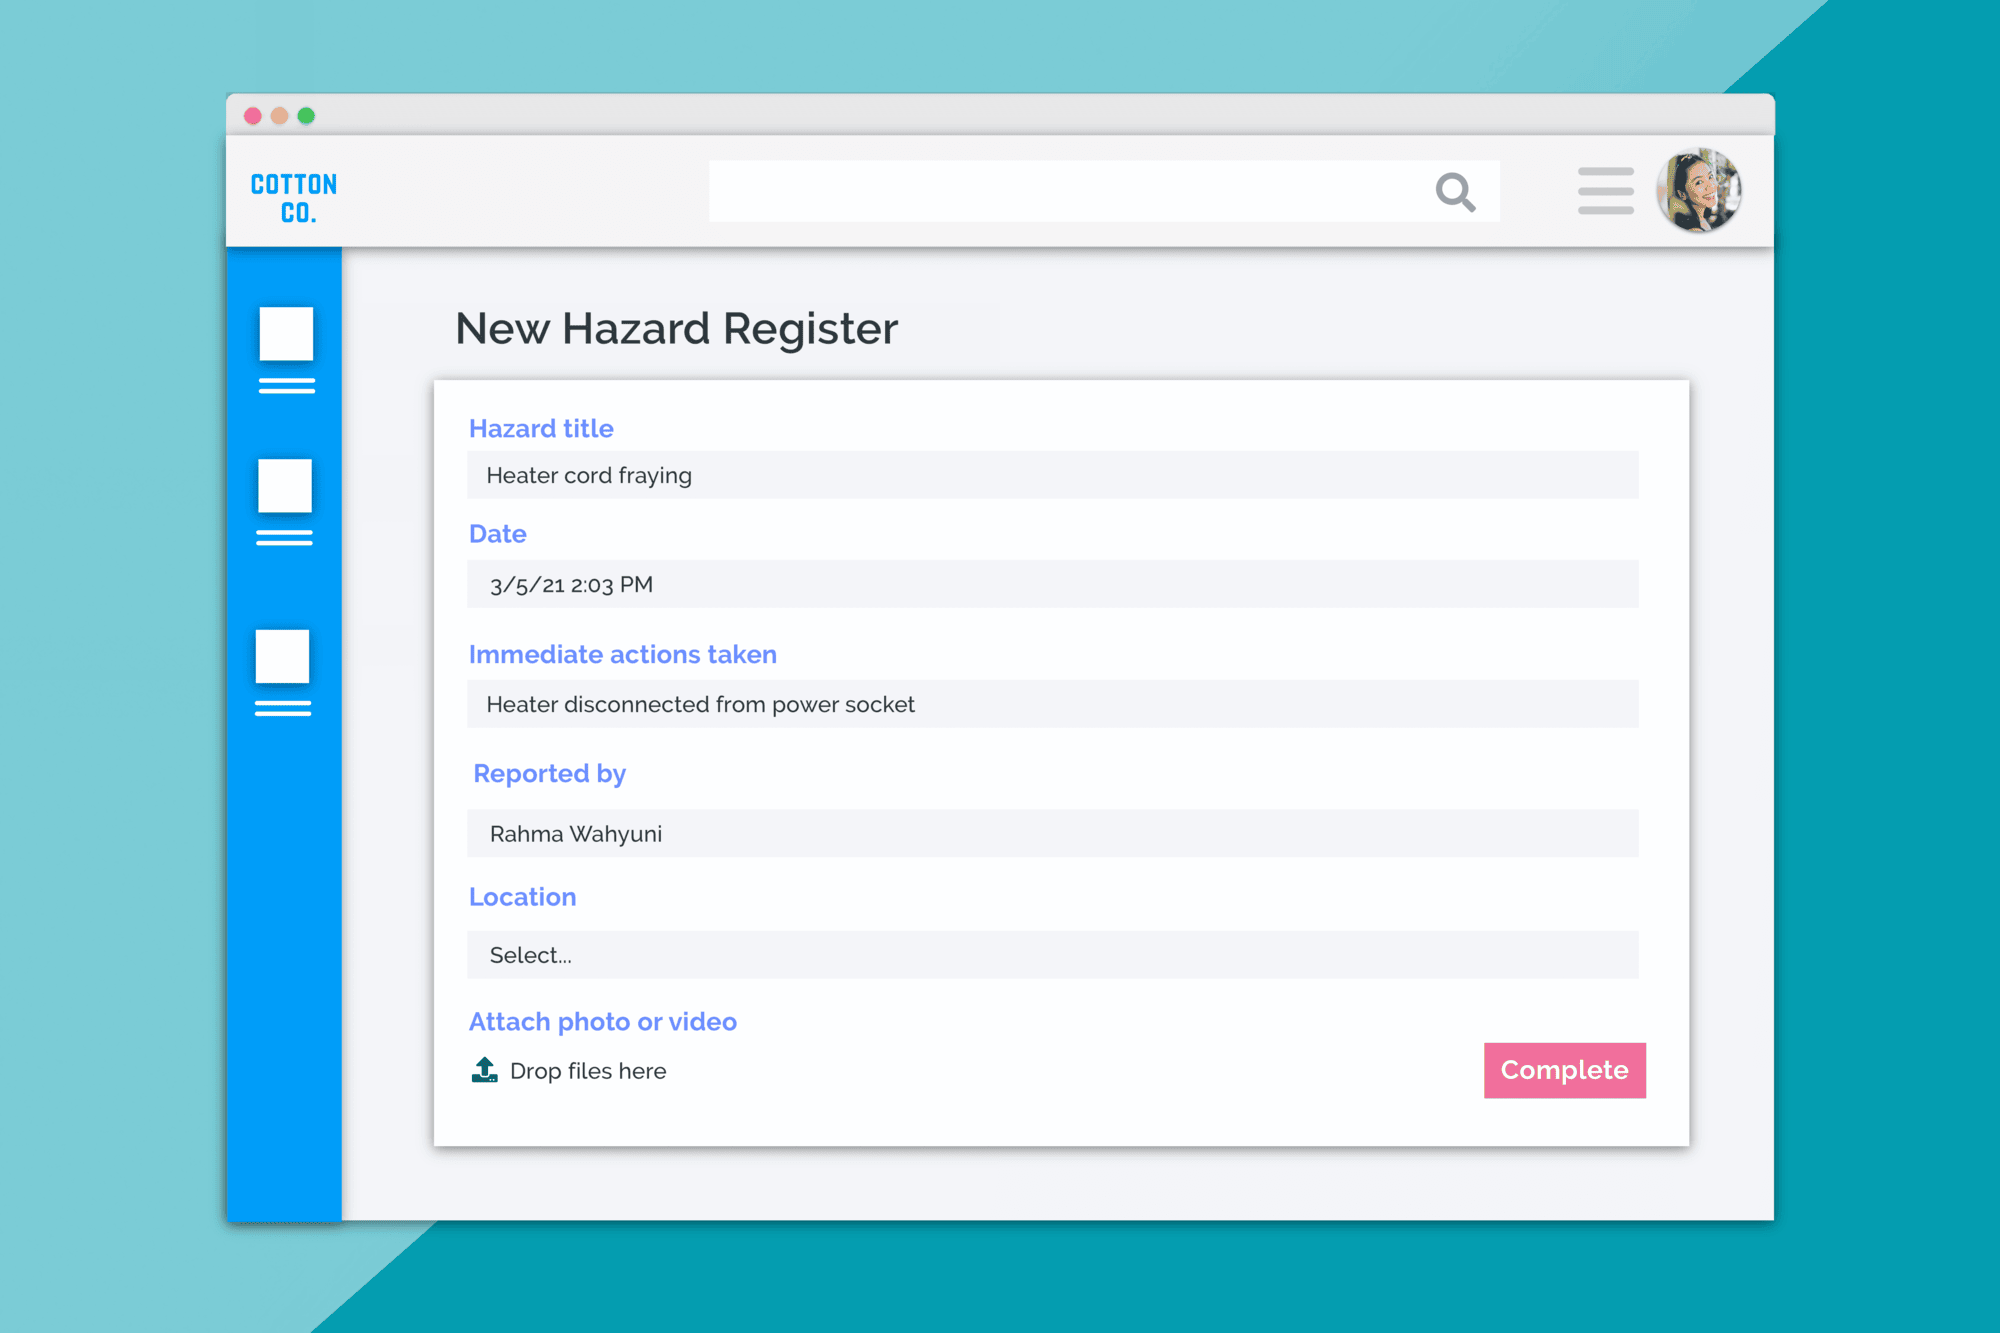
A widget shows surface information of a report, which can then be drilled into if clicked (or tapped) on. Any report can be turned into a widget, offering a huge amount of flexibility to make an on-the-go ‘command center’ that suits your needs.
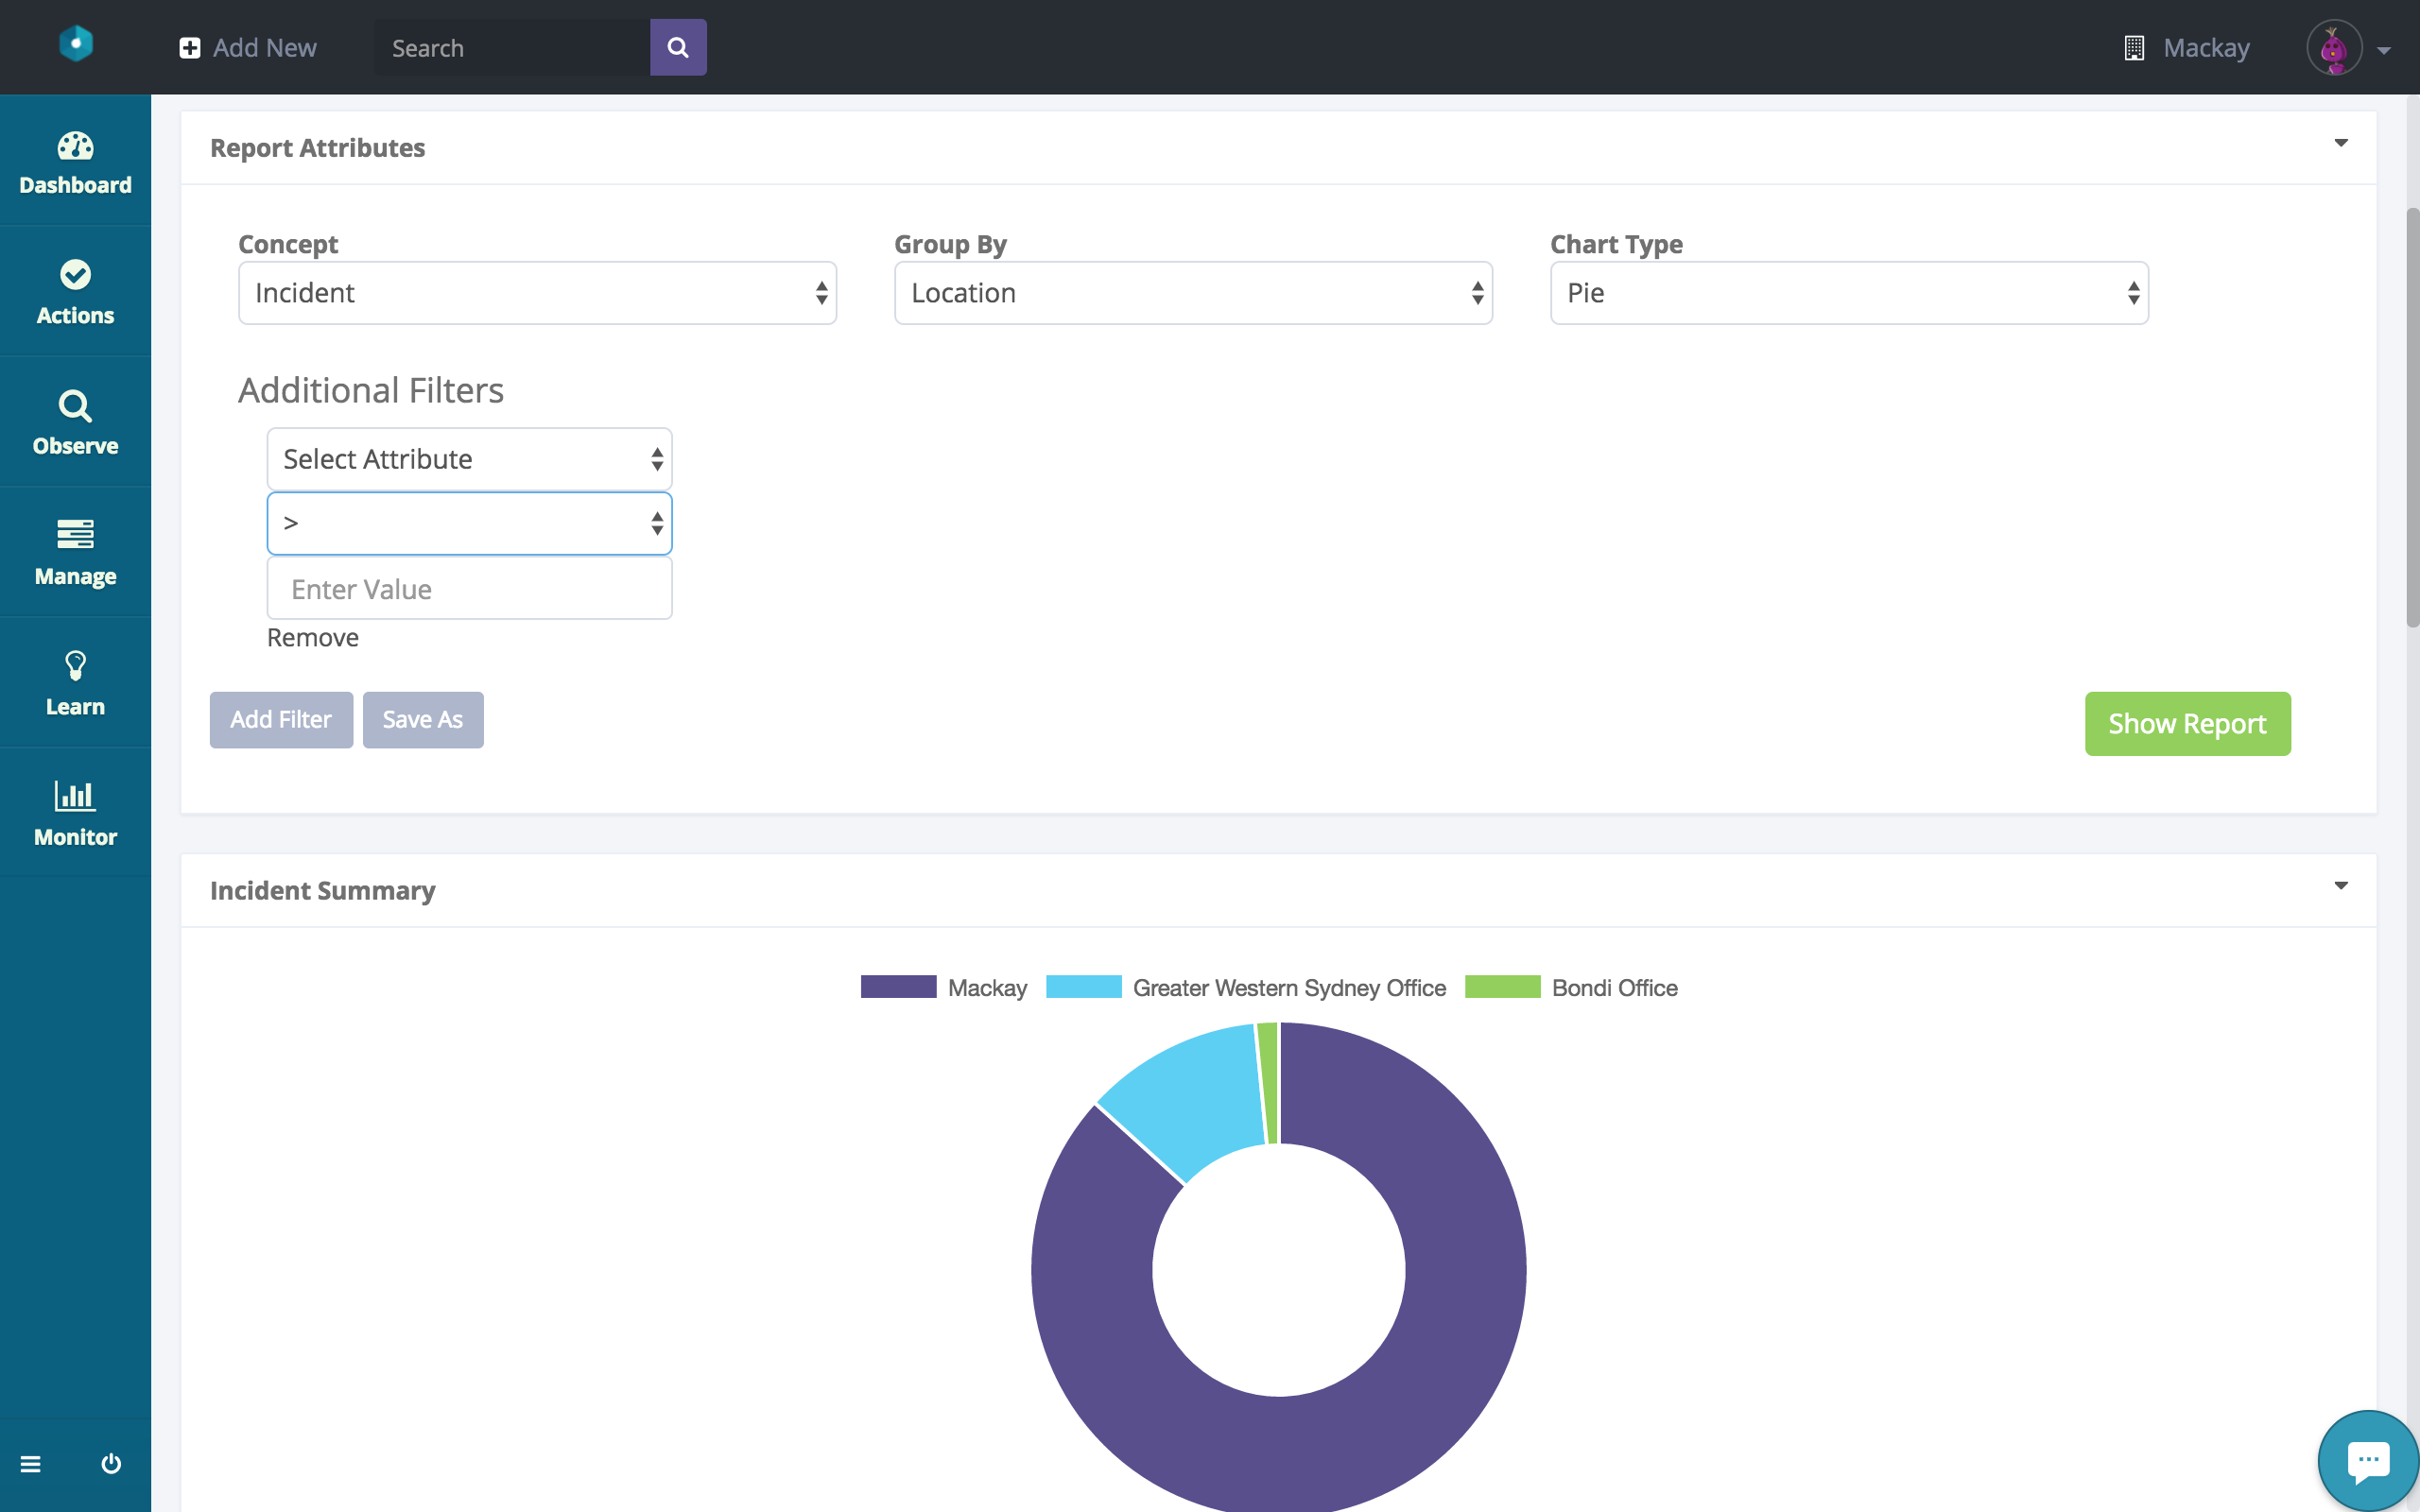
Report Attributes Section
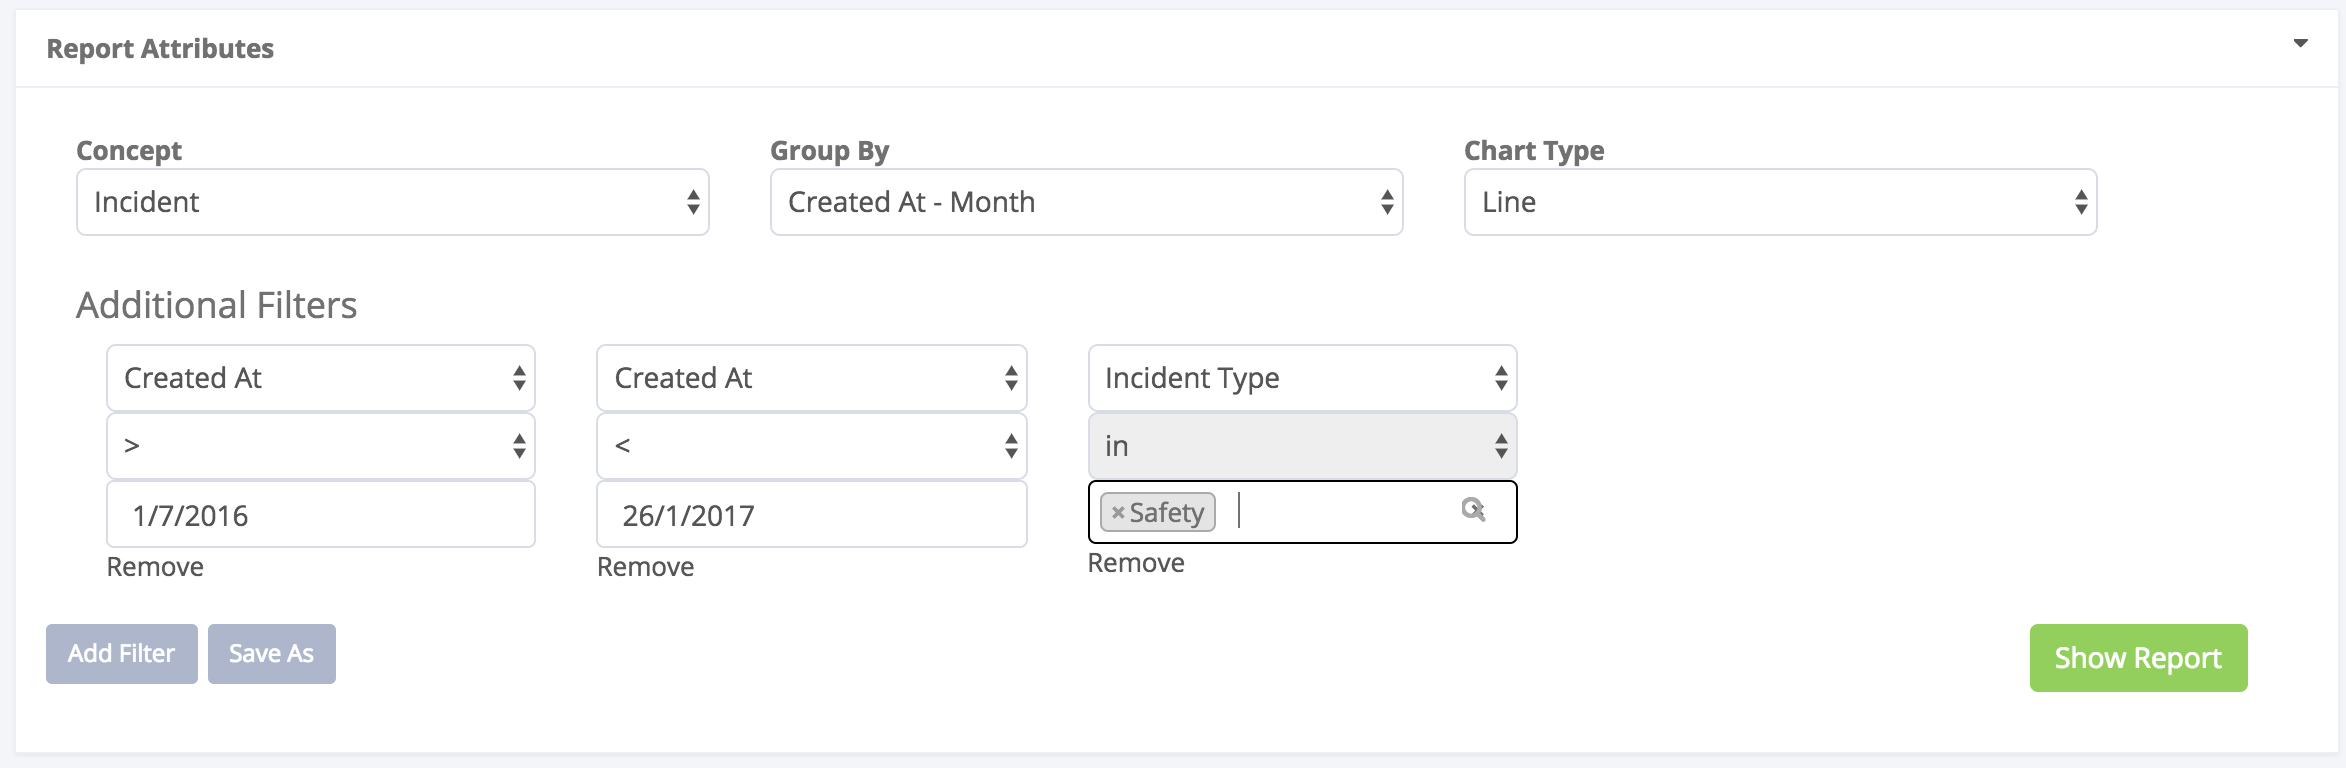
Here you set the criteria for your report. Choose your report type (Incident, Hazard, Worker’s Compensation, User or Audit), choose how you’d like to group it (eg by day/location/organization, etc), and select the chart type.
Underneath that, you can add filters for essentially any attribute related to that record type. For incidents, for example, you could add filters to only show you incidents created between two dates that happened in a particular location and that were of a particular incident type. There are a bunch of filters for each report type so feel free to have a play!
One quick note: In the first iteration of this builder, selecting a filter that may have nested data underneath it (Locations or Organizations) will only show the data from the selected value. That is to say, If you select “Sydney” as a location, it will only show data from the “Sydney” location; not any locations nested under Sydney. As these options are multi-select, you’ll need to go through and select individually which locations you wish to view.
Anyway, once you’re ready, click [show report] and your report will run.
Saving Reports
Once you’ve clicked “Show Report” if you’d like to save your report for future use, all you need to do is click ‘Save As’ and you’ll be able to give the report a name and then reload it in future. For example, you may wish to use certain criteria to produce a monthly report. Rather than recreate the report from scratch each time, you can save the basics and then reset the time filters each time you need to produce it. Reports are saved per user so each user can set and create their own custom reports specific to them.
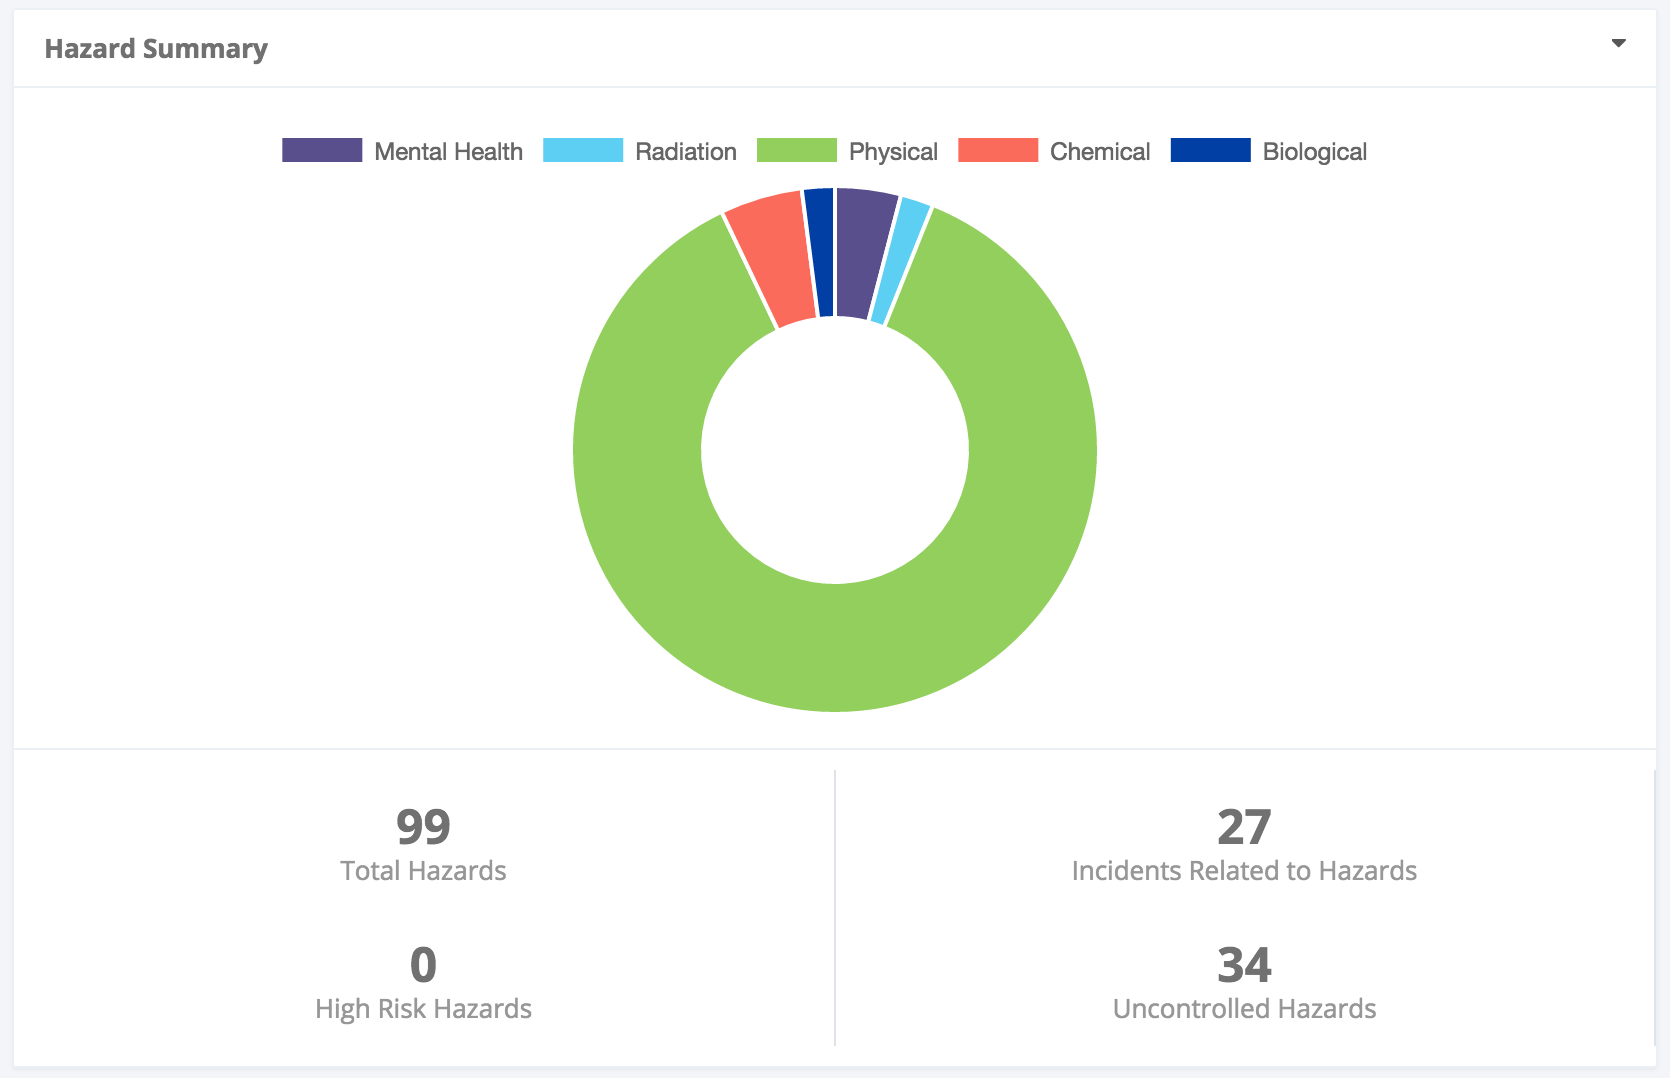
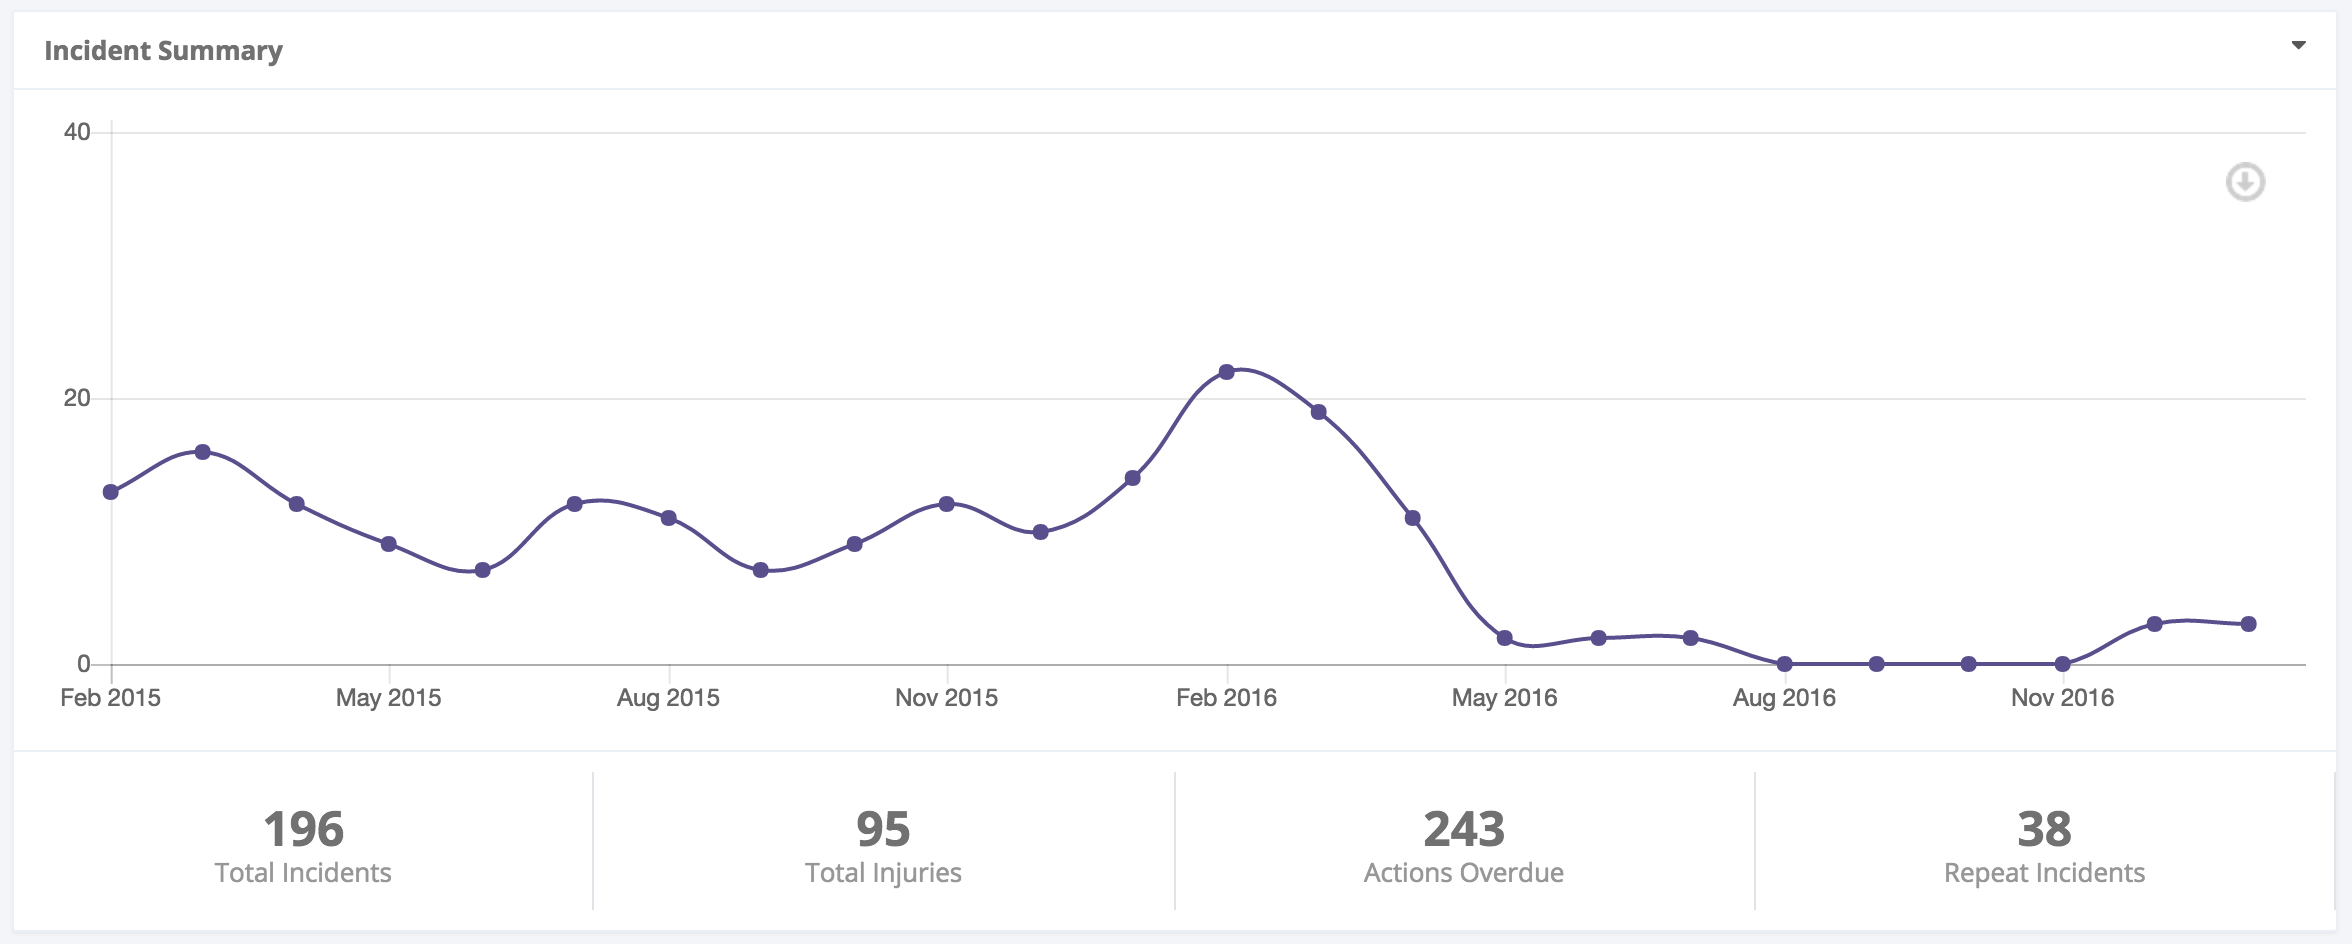
Summary Chart
Once you click ‘Show Report’, a visual representation of your report attributes will be displayed below along with a handful of useful stats. This chart can be downloaded in .png format by clicking on the download button.
Details Section
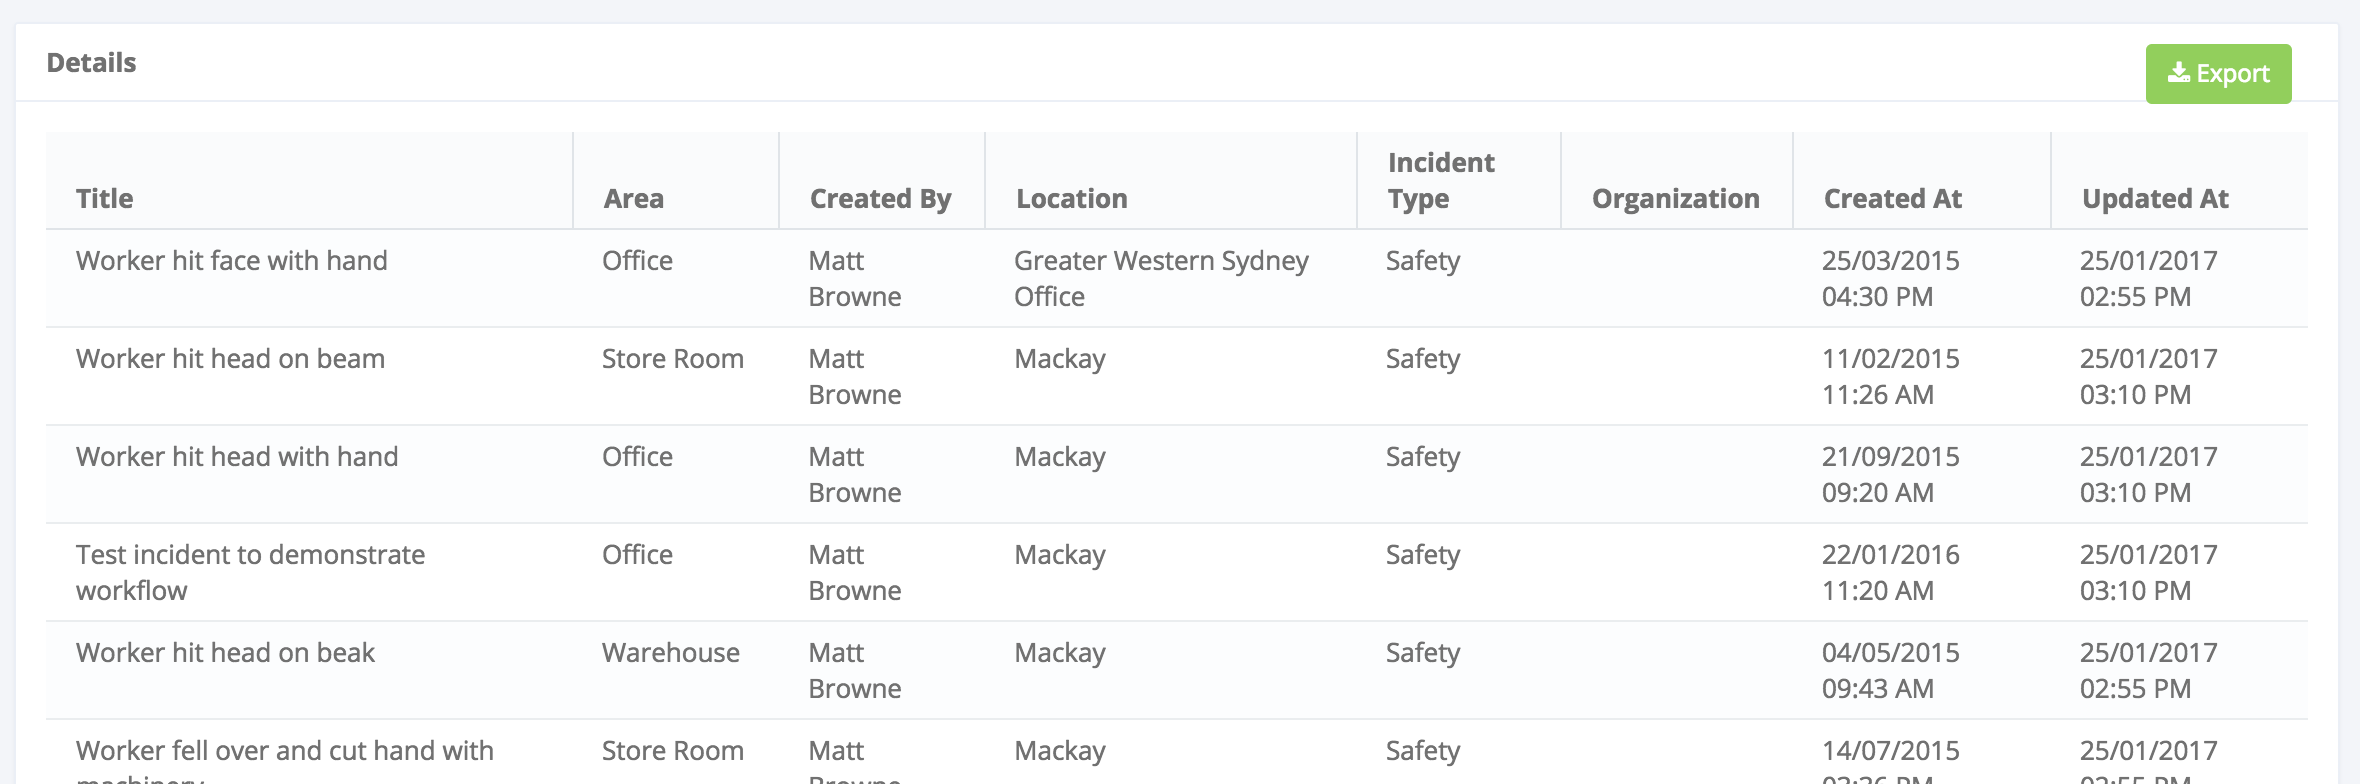
Here you get access to every record returned as part of your report attributes. The real power of this section is the quick export button at the top. This exports the data to CSV format to allow you to run any type of report you’d like within Excel. This effectively opens up your data within Donesafe without needing to complete a full system export.
Record Access Security
The report builder doesn’t allow users to see data that they otherwise wouldn’t be able to. Where the summary chart will show full data sets, the details section will only display information that the active user has rights to view. This means that if you only have view rights for five records out of 150 records within a location, the chart will display data pertaining to all 150 records wherein the details section you’ll only see information on those five. This is to protect individual confidentiality where confidential detail may be recorded within say, for example, and incident title.
How to access the report builder
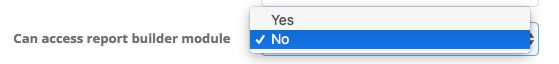
Access to the report builder is restricted by role. To enable access by role, simply go to Roles, select the Role to which you’d like to give access and then, next to “Can access report builder module”, select ‘Yes’. Once that’s saved, users under the role you’ve selected will now be able to access the new builder under the monitor section
And that’s it! Now it’s up to you to jump over and get experimenting. Remember if you have any trouble or any suggestions please let us know at hello@donesafe.com . We look forward to hearing from you.
Share: